Your Community College
SLCC Strategic Plan 2016-2023
Vision
Salt Lake Community College will be a model for inclusive and transformative education, strengthening the communities we serve through the success of our students.
Mission
Salt Lake Community College is your community college. We engage and support students in educational pathways leading to successful transfer and meaningful employment.
Values
Collaboration We believe we're better when we work together. Community We partner with our community in the transformative, public good of educating students. Inclusivity We seek to cultivate an environment of respect and empathy, advanced by diverse cultures and perspectives. Integrity We do the right things for the right reasons. Innovation We value fresh thinking and encourage the energy of new ideas and initiatives. Learning We learn as a college by building outstanding educational experiences for students and by supporting faculty and staff in their professional development. Trust We build trust by working together in good faith and goodwill to fulfill the College's mission.
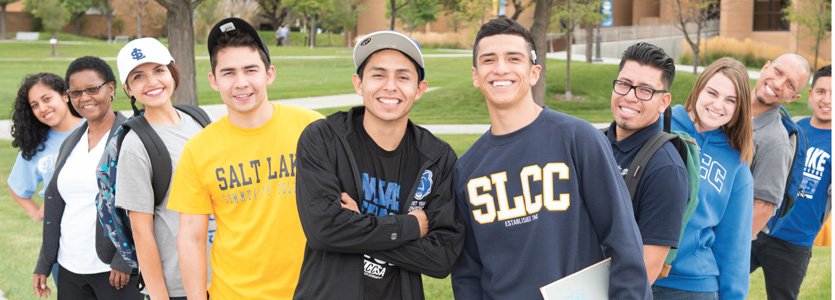
SALT LAKE COMMUNITY COLLEGE will celebrate its 75th anniversary in fall 2023. This milestone is a testament to past accomplishments and a catalyst for transforming the college in the future. We've come a long way since our founding as a small technical college in 1948. We now serve tens of thousands of students at 10 sites and online throughout the Salt Lake Valley.
As an emerging Hispanic-Serving Institution (HSI), SLCC leads the state with the highest enrollment of students from the Latinx/a/o community. However, an HSI identity is far more complex than simply enrolling students. For SLCC, serving the Latinx/a/o community is aligned with our mission, vision, and values. The federal designation of HSI is not an end goal but a commitment and affirmation of our dedication to becoming a model for inclusive and transformative education, strengthening the communities we serve through the success of our students. Learn more about SLCC as an emerging HSI.
The Salt Lake Community College Strategic Plan includes five overarching goals that guide our work:
Increase Student Completion
#1 - Implement SLCC Pathways
#2 - Deploy Strategic Course Scheduling
#3 - Expand Student Employment on Campus
Improve Transfer Preparation & Articulation
#4 - Grow 2+2 University Partnerships
Align With and Respond to Workforce Needs
#5 - Align & Expand Technical Education & Occupational Trainings
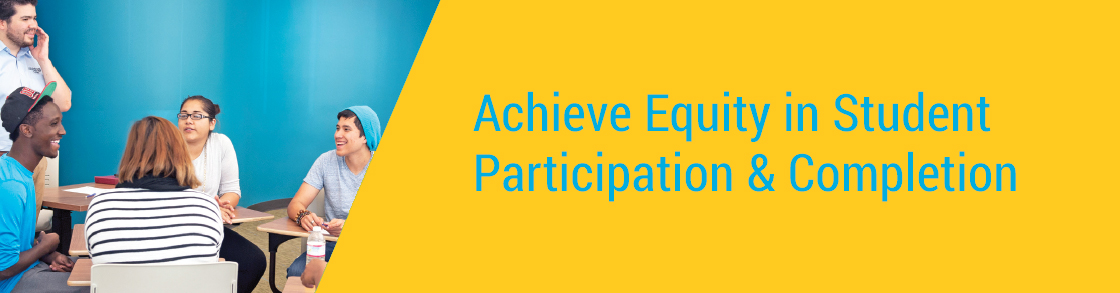
Achieve Equity in Student Participation & Completion
#6 - Emerging Hispanic Serving Institution (HSI)
#7 - Increase Diversity in Hiring & Retention
#8 - Engaging Communities
Secure Institutional Sustainability & Capacity
#9 - Increase College Participation
#10 - Develop & Implement Program-Level Outcomes & Assessment
Each goal is supported by one or more strategies or Collaborative Work Teams (CWTs), committees of stakeholders who are tasked with leading the efforts to achieve our goals. These committees are overseen by a member of the Executive Cabinet, led by a senior leader, and are given an annual charge with specific milestones to be achieved during the academic year. CWTs differ from strategies in that they are a particular focus of the college and typically include more stakeholders.
Throughout the year, senior leaders review progress made on each of the strategies and CWTs. They critically examine the recommendations proposed by each team and assess their efficacy as they consider revising the strategic plan.

Early indicators suggest completion is trending upward, but in order to achieve our goal of a 40% six-year completion rate, we need to support an additional 1,000 students in finishing their studies at SLCC.
Completion Strategies (2021-2023)
Strategy No. 1: Implement SLCC Pathways
This year, Area of Study (AOS) Design Teams will take the lead in continuing the implementation of Pathways. In addition to completing program mapping frameworks, they will assist in developing a more robust program review process and improving English, ESL, and Developmental Education placement. New this year, design teams will focus on building Area of Study community models to more deeply engage with community and across college divisions.
Strategy No. 2: Deploy Strategic Course Scheduling
Strategy leads are tasked with obtaining and implementing software to optimize and analyze course scheduling processes. They will lead the development of a comprehensive and transparent scheduling handbook to provide more specific direction on how to schedule emerging sites where we're trying to grow enrollment. Recent literature suggests 8-week courses are associated with better student outcomes; the leads will identify programs suitable for this pilot and develop a model for delivering courses in this time frame.
Strategy No. 3: Expand student employment on campus
On-campus employment is considered a high impact practice, closely associated with positive student outcomes. We seek to expand these opportunities by increasing the number of work study positions, developing fellowship and stipend options for undocumented and international students, and training staff and faculty to use student hiring platforms.
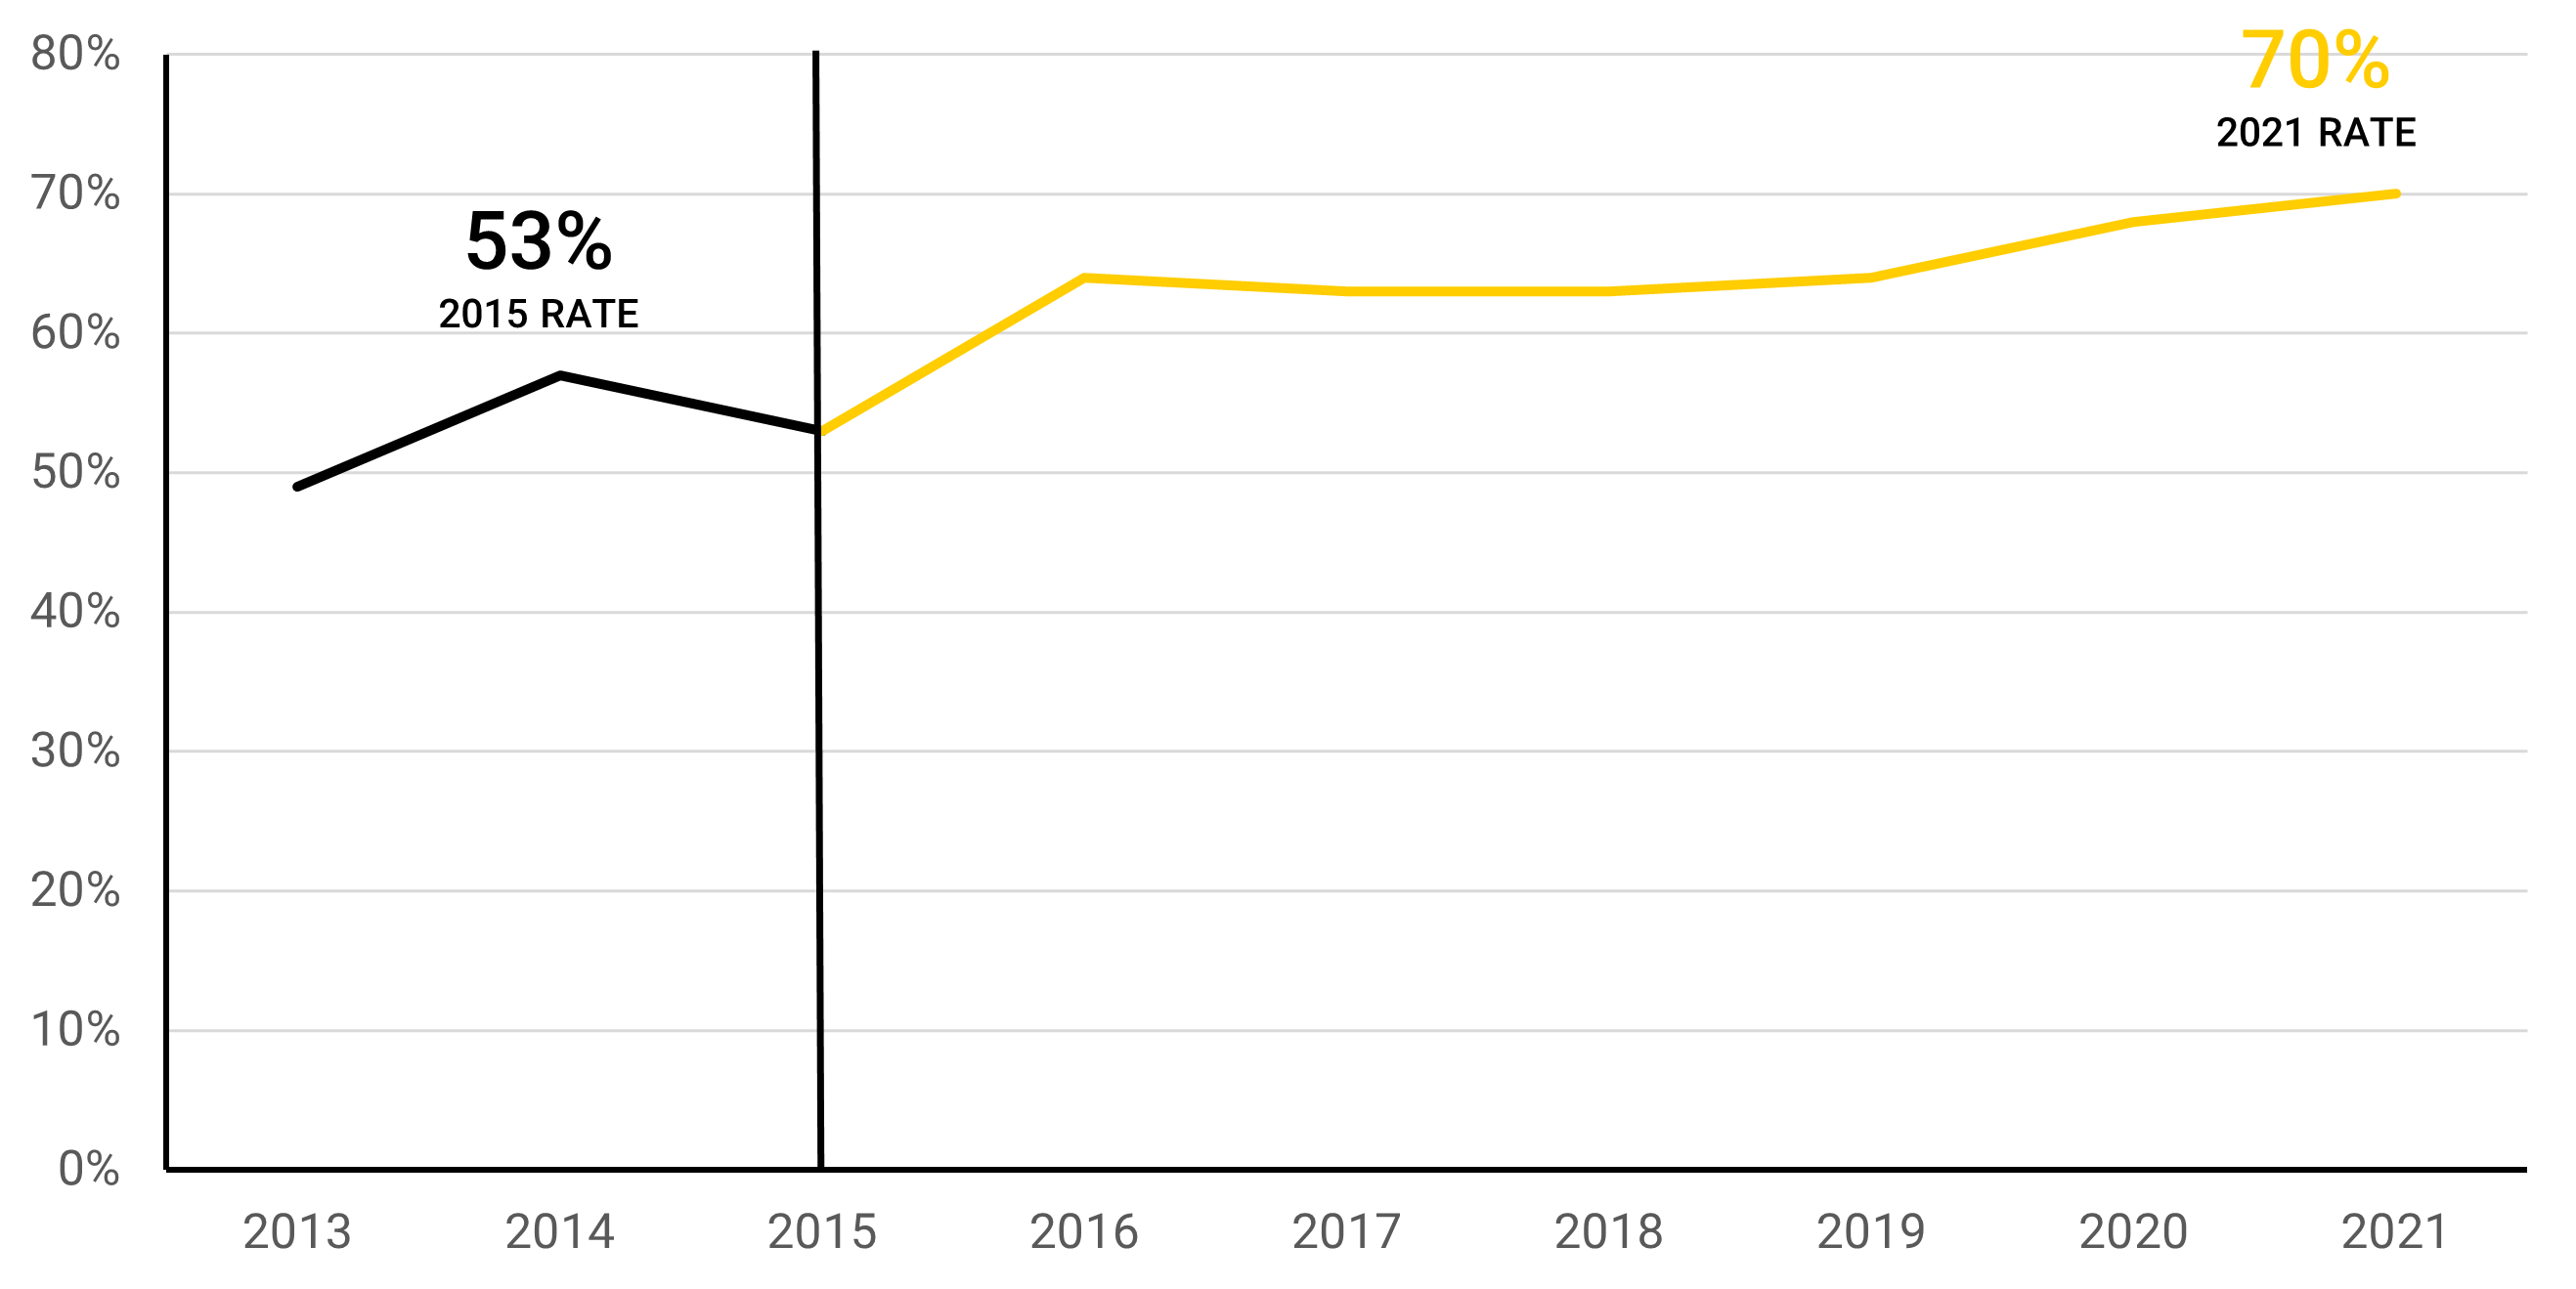
Six-year Completion Rate
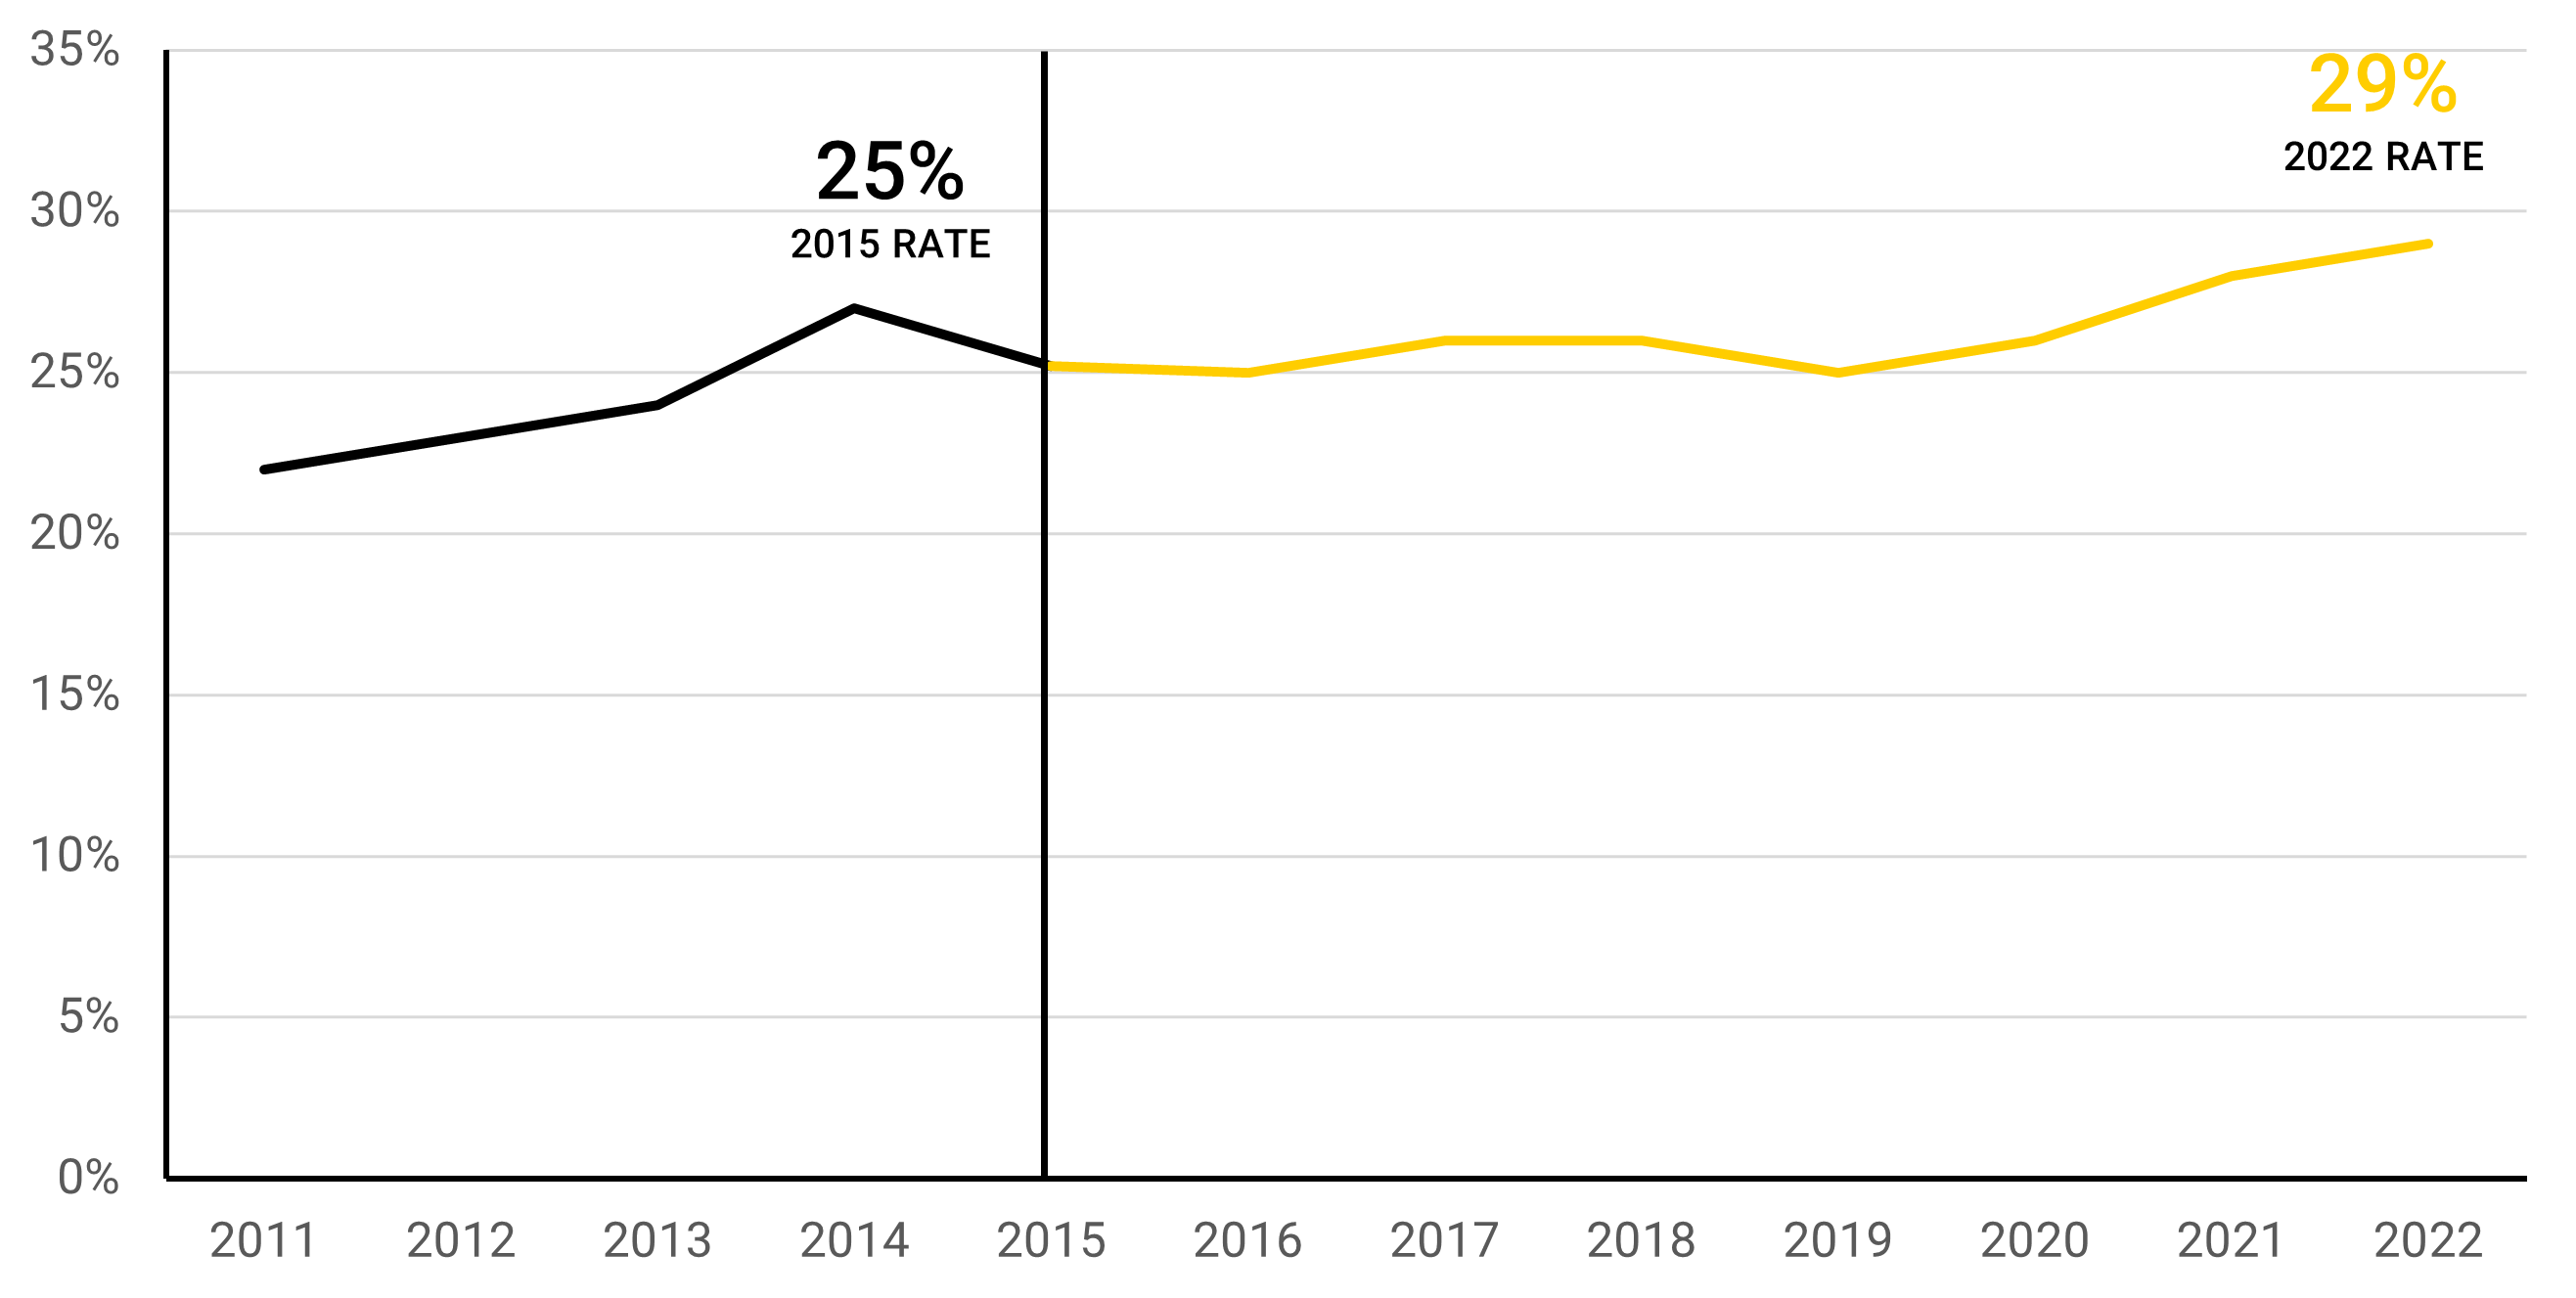
Target: 40%
Trend: Up
Percentage point change from 2015: 4
Percent Achieved: 73%
Note: This figure represents the percent of students who earn a degree or certificate within six years of first enrolling at SLCC, e.g., the 2022 figure is based on the cohort of students who began in 2016. Students who transfer without completing a credential are not included in the numerator.
Most SLCC students express an interest in eventually earning a bachelor's degree. We must ensure they are academically prepared for upper-division coursework and that our programs articulate seamlessly. Successful transfers require institutional partnerships. Utah's transfer to bachelor's -completion rate is low and suggests SLCC must assume a broader statewide leadership role.
Transfer Strategies (2021-2023)
Strategy No. 4: Grow 2+2 University Partnerships
In order to support our students in bachelor's degree completion, strategy leads are working to increase the number of hosted bachelor's degree options with our transfer partners. This will allow SLCC graduates to remain in the Salt Lake Valley to complete their four-year degree. SLCC is also exploring the possibility of developing applied baccalaureate degree programs.
Transfer Degree Conversion Rate
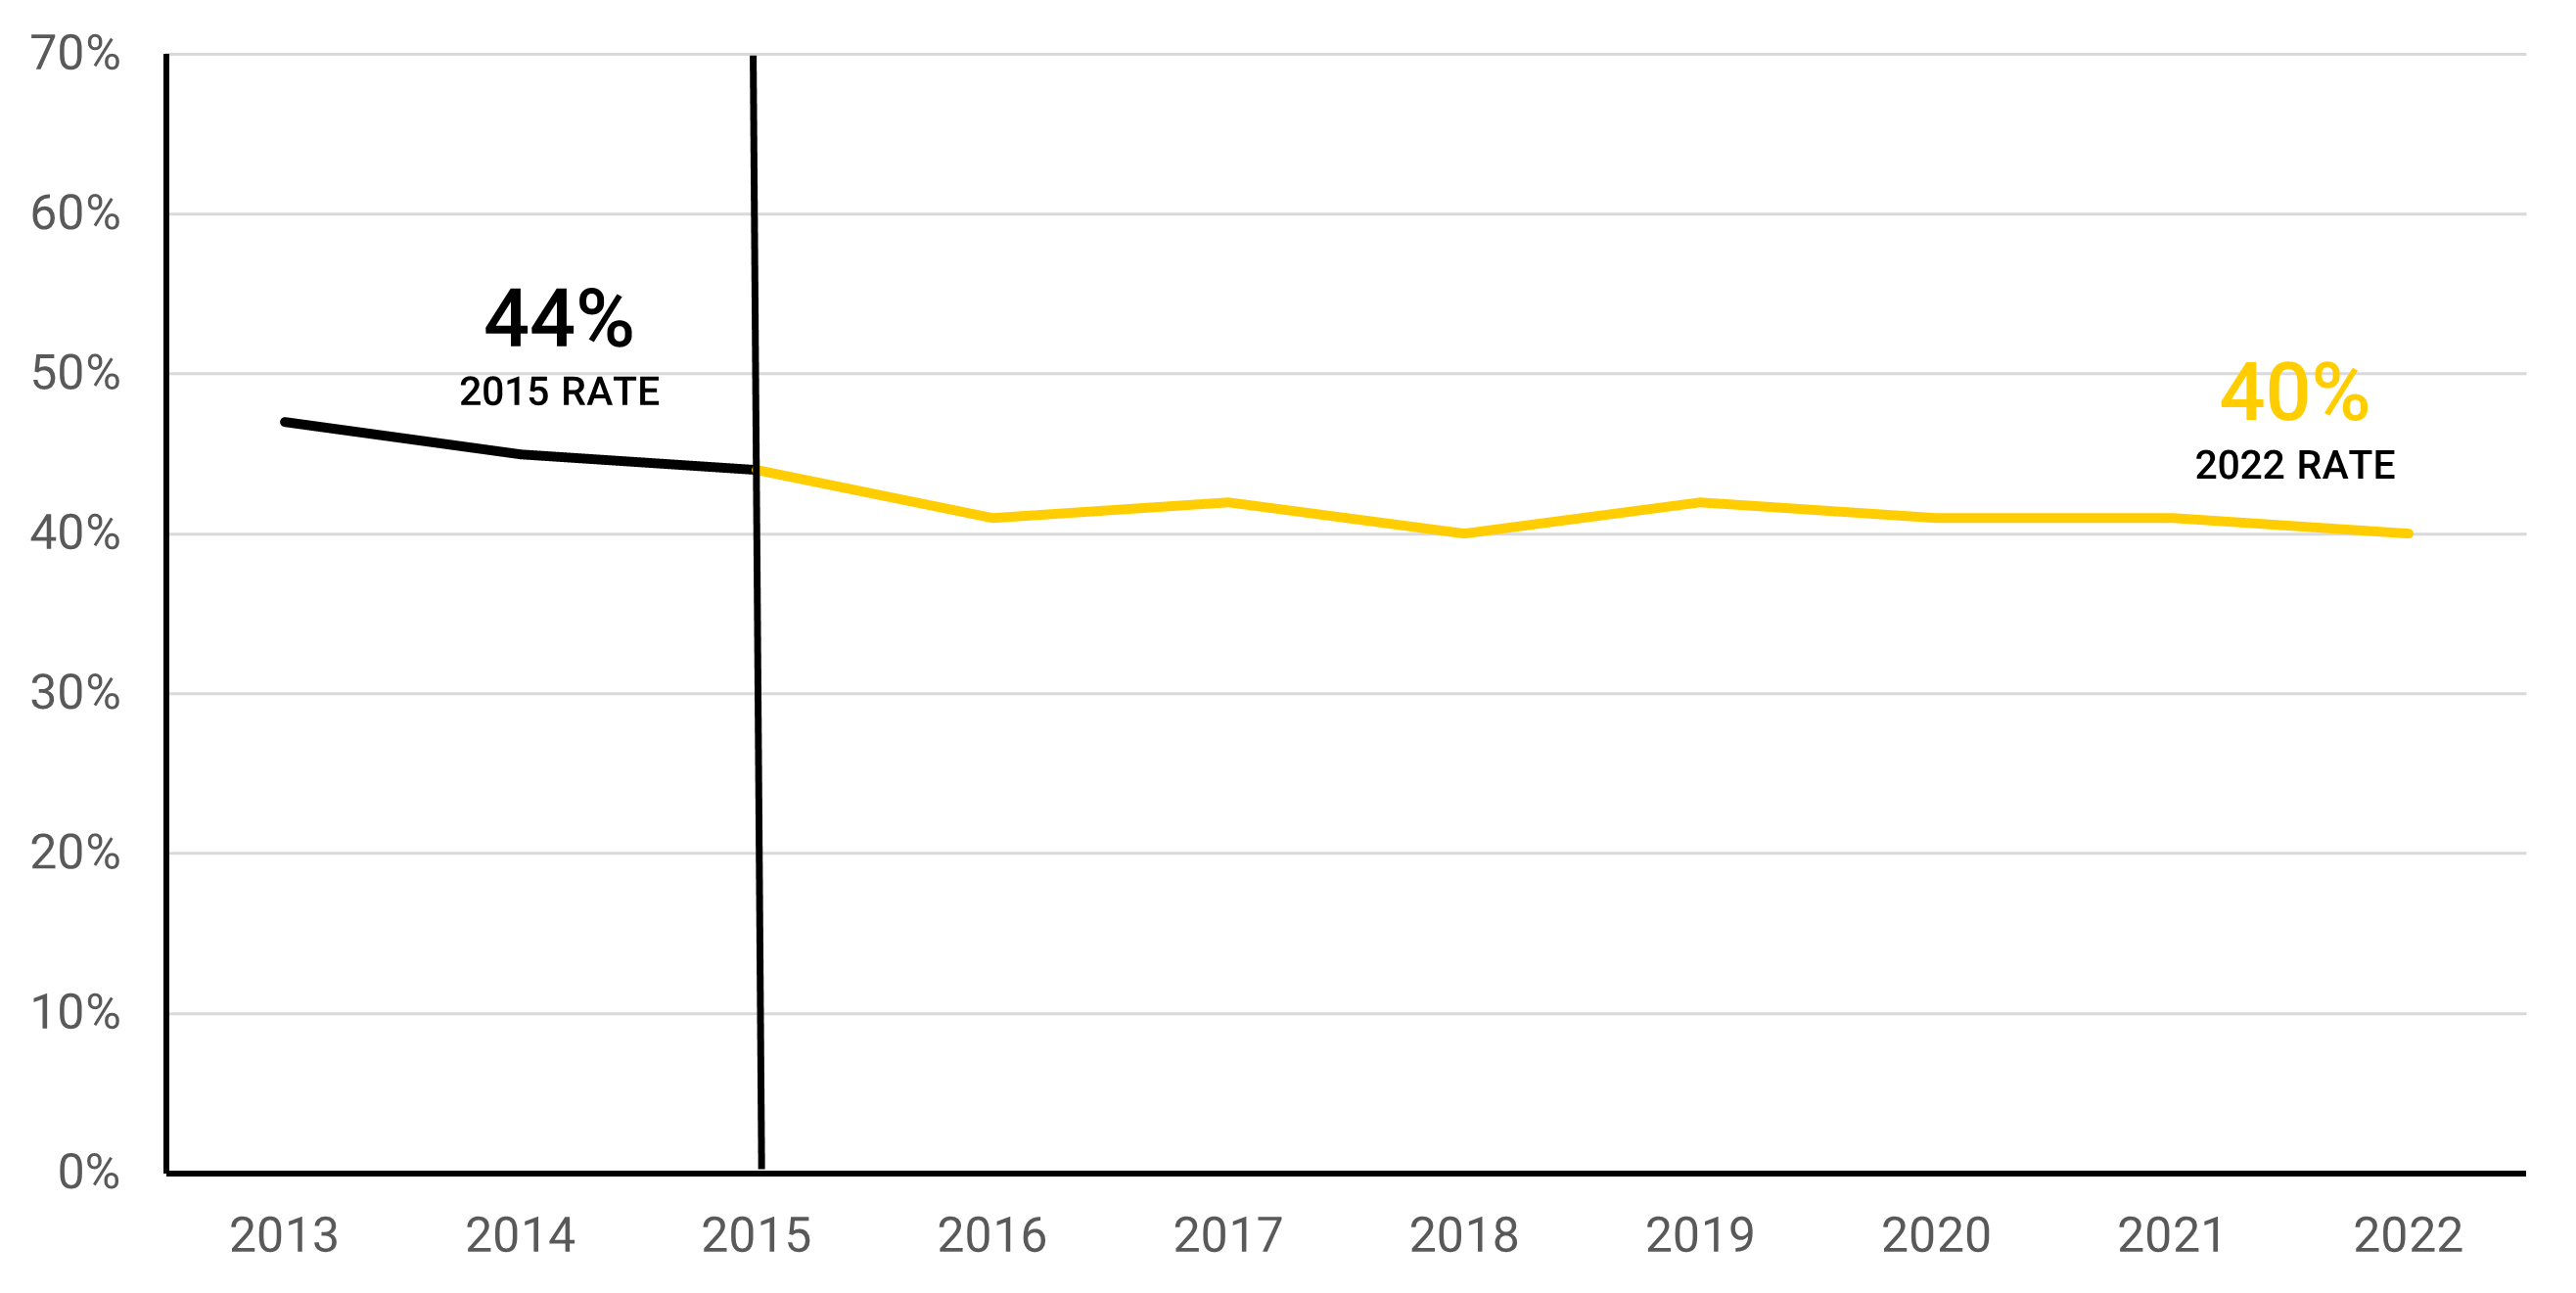
Target: 60%
Trend: Flat
Percentage point change from 2015: 4
Percent Achieved: 67%
Note: This metric represents the proportion of AA/AS/APE graduates who earn a bachelor's degree within 4 years of completing at SLCC. The 2022 figure is based on students who completed their credential in 2018.

SLCC provides workforce training in two ways. The first is measured among our "credit" and "competency" offerings, which focus on certificate and degree programs. The second is through industry partnerships we develop through specialized training and continuing education. These efforts are sometimes referred to as "noncredit" offerings. Our goal for these programs is that SLCC graduates become the most sought-after candidates for hiring.
Workforce Strategies (2021-2023)
Strategy No. 5: Align & Expand Technical Education & Occupational Trainings
In continuing to align Salt Lake Technical College offerings with system and tech colleges, strategy leads are implementing an Education and Career Pathways Program Advisory Committee (ECPAC) to aid educators in the design, development, implementation, evaluation, maintenance, and revision of professional, career, and technical programs. As part of rebranding, strategy leads will oversee the design and launch of a new SLTC marketing campaign.
CTE Competitive Wage Rate
Target: 65%
Trend: Up
Percentage point change from 2015: 17
Percent Achieved: 108%
Note: This rate measures the percent of Career and Technical Education graduates who earn above the Salt Lake County median wage for those with some college or an associate's degree (about $36,000 in 2015) one year after completing a credential. Wage data are provided by the Utah Department of Workforce Services.
SLCC will continue to become more inclusive in our services, curriculum and hiring. Our shared values will ensure transformative educational experiences for the diverse communities we serve. Our strategies connect access with success to ensure equitable results in student participation and completion.
SLCC is the most diverse institution of higher education in Utah, but its student population is less diverse than that of Salt Lake County. SLCC actively seeks to equitably represent all populations in enrollment and graduation at a 1:1 ratio, mirroring county demographics. To achieve our participation and completion goals, we will improve equity, inclusion and diversity across the college.
Equity and Completion Strategies (2021-2023)
Strategy No. 6: Emerging Hispanic Serving Institution (HSI)
Because of shifting demographics in our service area, we are developing and implementing practices to better serve our growing Latinx population. In so doing, we may improve outcomes for all students. This year, this strategy will focus on building organizational infrastructure throughout the college to support becoming an HSI. This includes participating in national conferences, ensuring Spanish language inclusion across the institution, and engaging with Latinx communities through employment and soliciting input in areas impacting the community.
Strategy No. 7: Increase Diversity in Hiring & Retention
National research suggests that student success increases when students see their racial, ethnic and/or gender identity reflected in faculty and staff. This year, the strategy will focus on creating a toolkit for Associate Deans to assist in seeking out more diverse faculty hires. PWC will begin implementing an exit survey to identify opportunities for improvement in retention and campus climate. Finally, strategy leads will assist in developing a reporting tool to track and display outcomes of PWC hiring and retention efforts.
Strategy No. 8: Engaging Communities
In order to better serve our community, this strategy will focus on defining a community-led learning mission for the West Valley Center. In addition, leads will continue to expand K-12 and community outreach efforts, including targeted messaging for Associates degrees, Salt Lake Technical College, and Workforce and Economic Development.
Participation Ratio
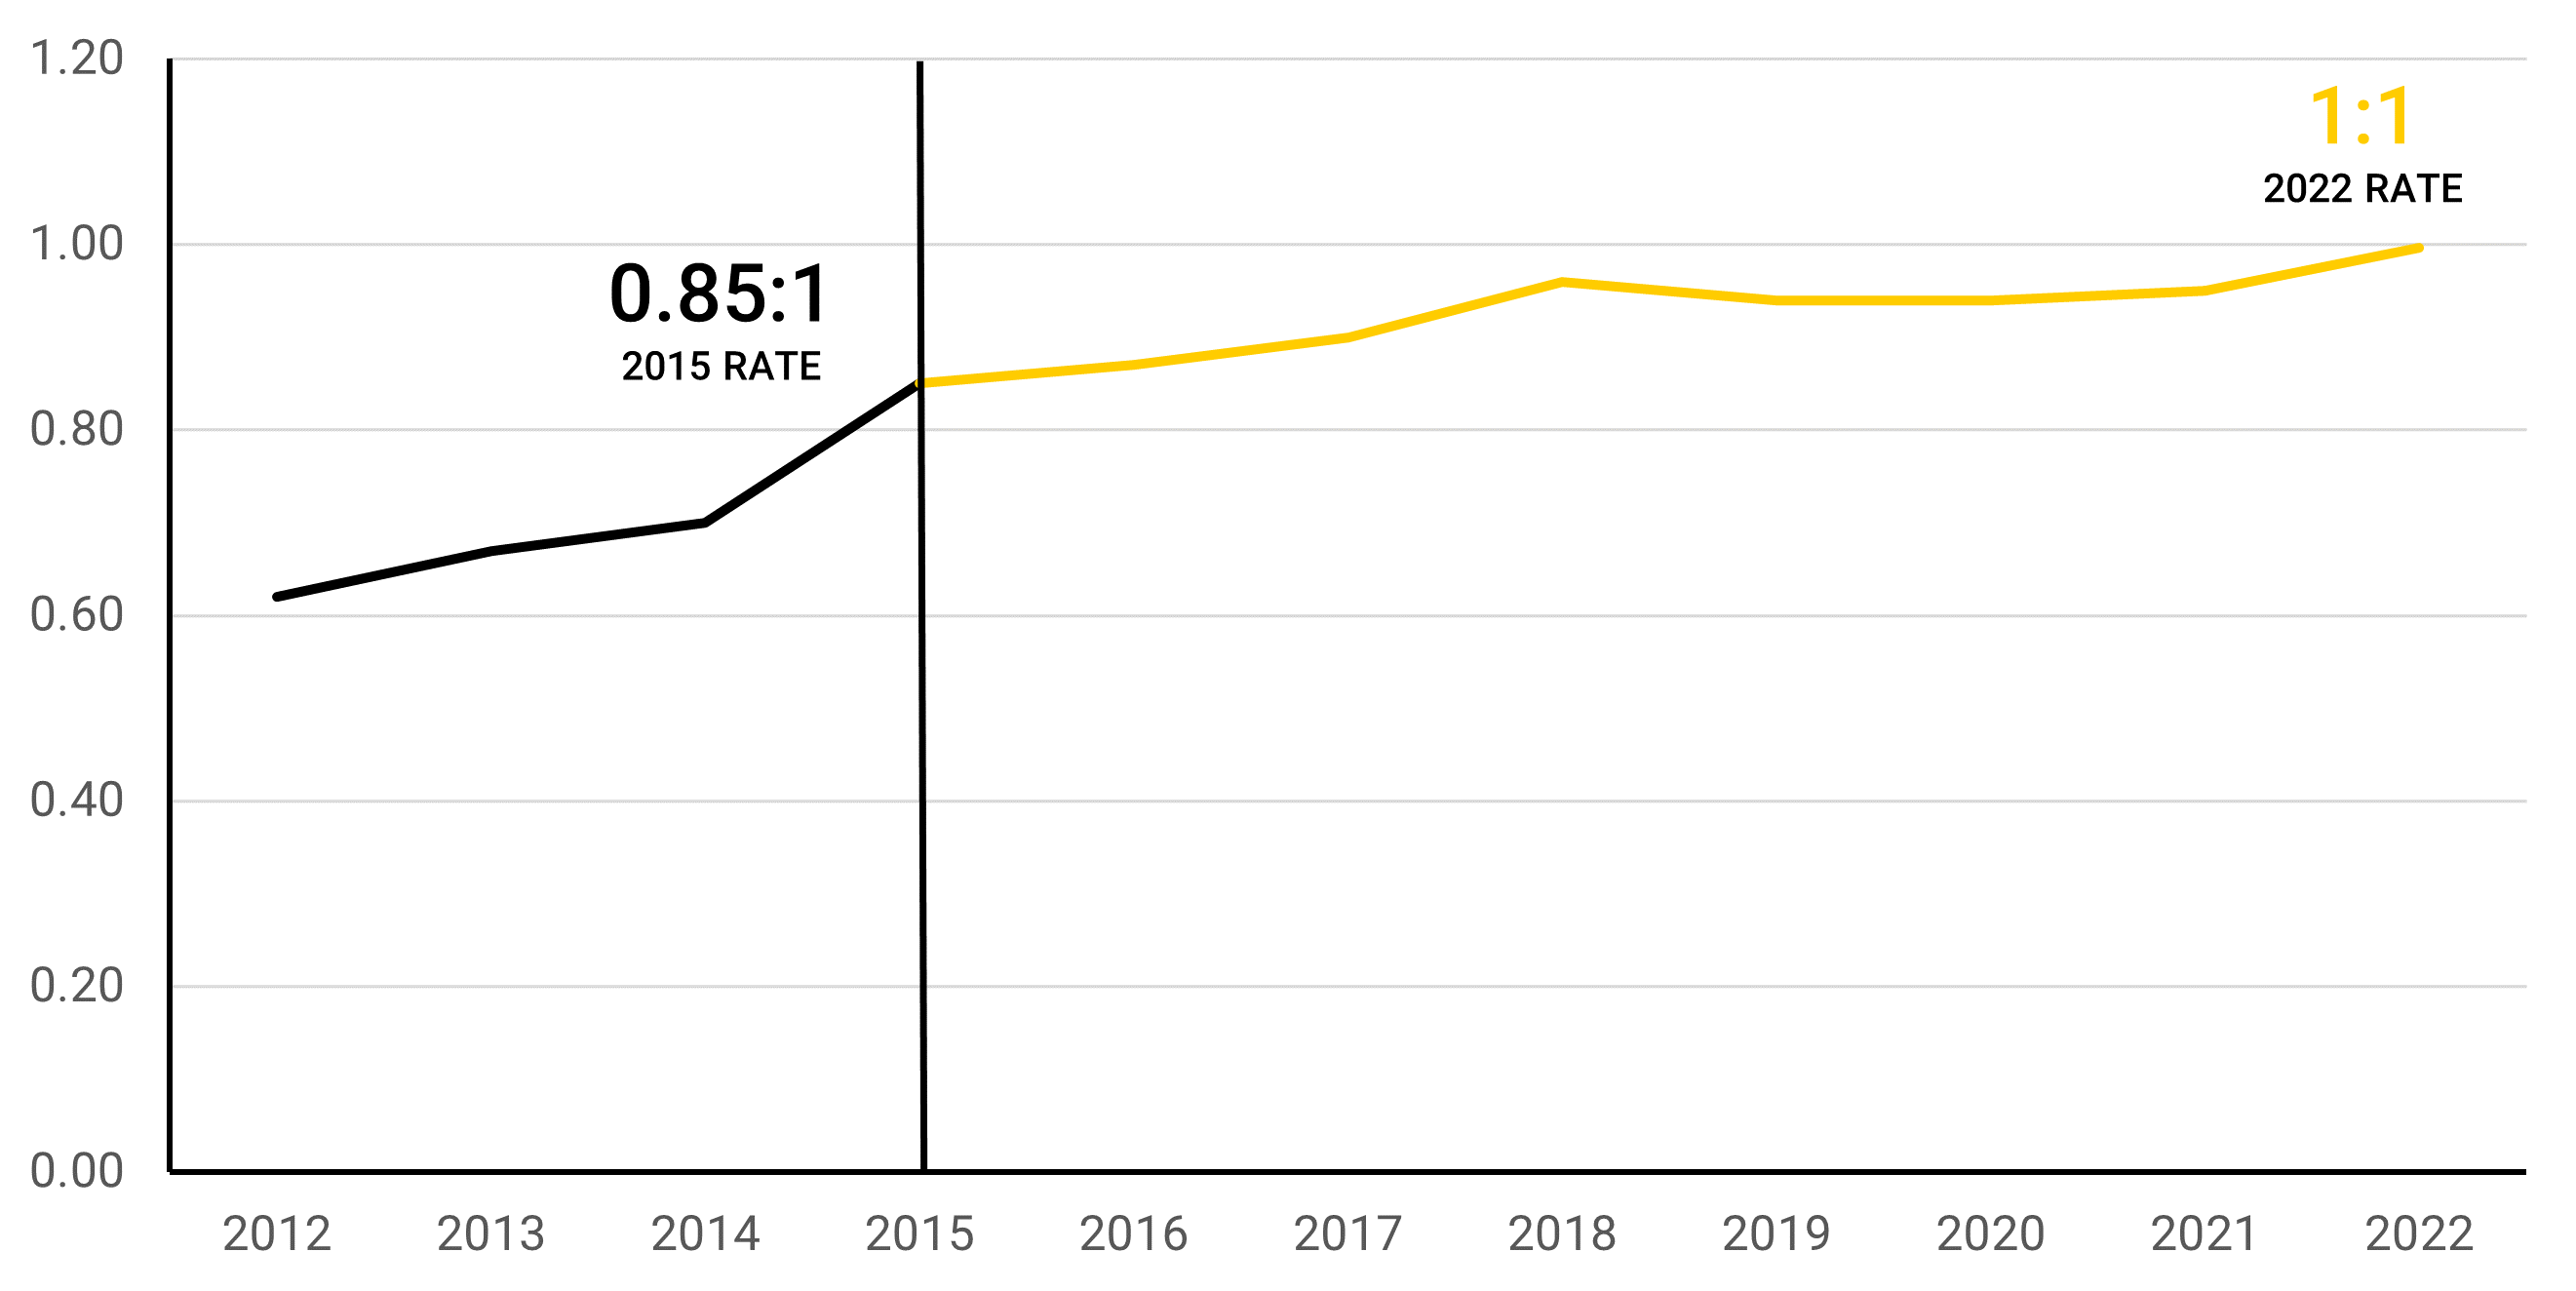
Target: 1:1
Trend: Up
Percentage point change from 2015: 15
Percent Achieved: 100%
Note: The participation ratio gives the proportion of students of color attending SLCC divided by the proportion of residents of color in Salt Lake County. When this figure is 1:1, it indicates SLCC's student population reflects the community we serve. When the student body is more diverse, the first number in the ratio rises above one; when it is less diverse, it falls below one.
This metric will be updated in February
Opportunity Gap in Completion
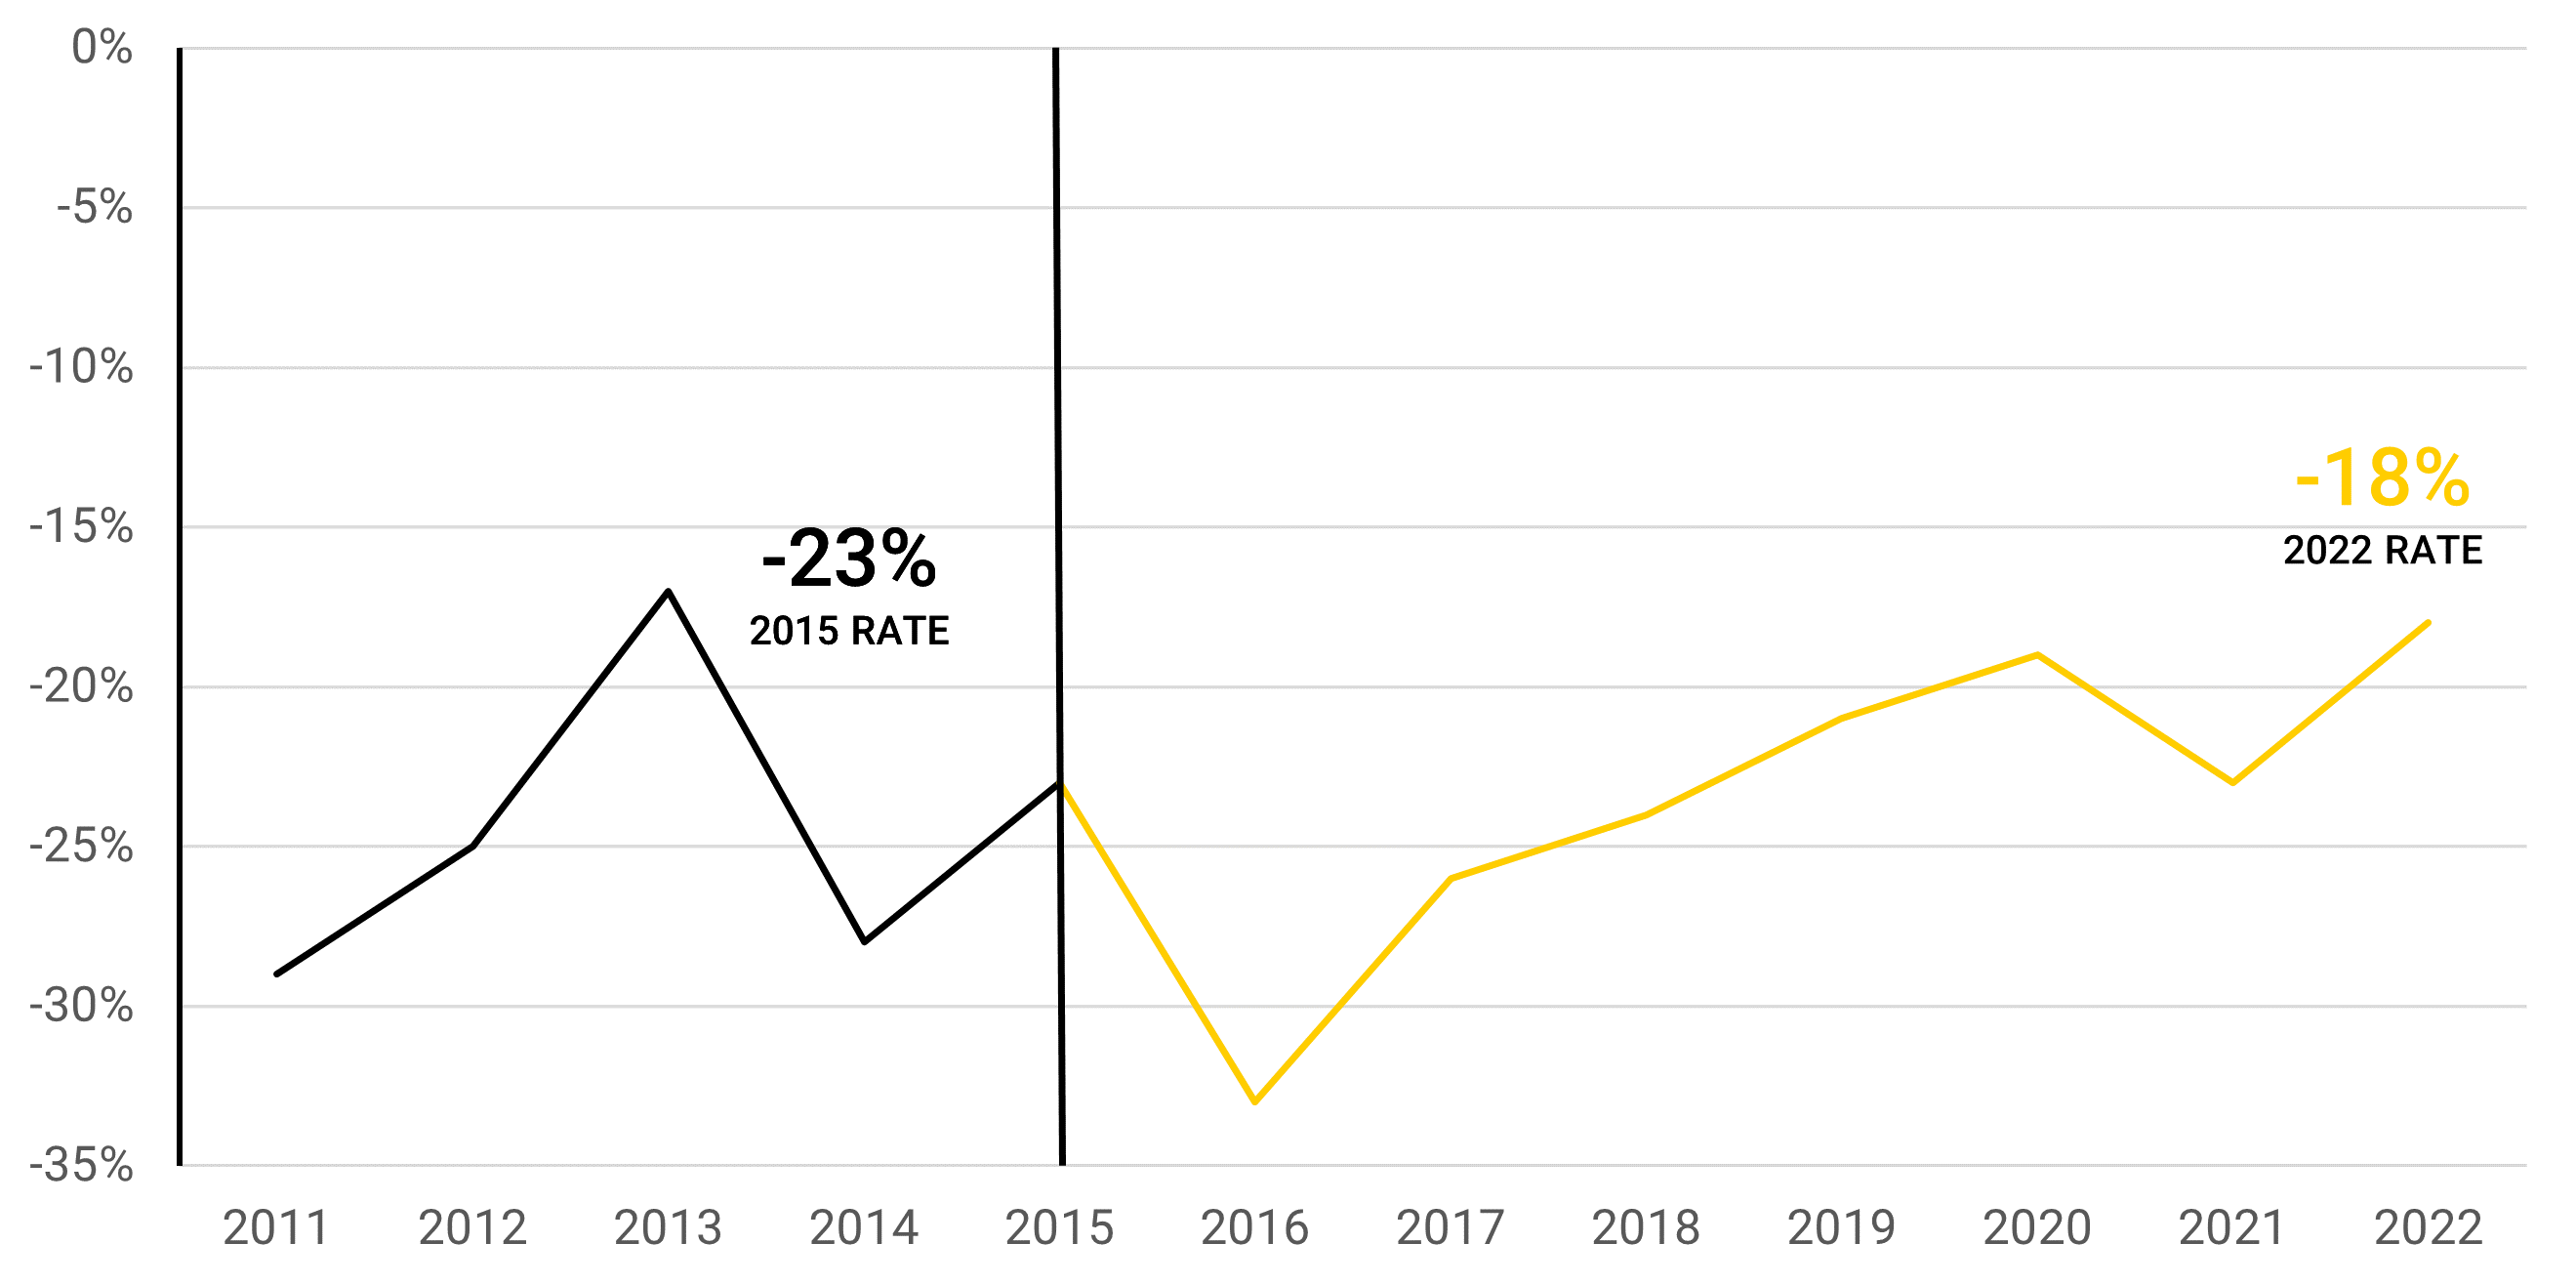
Target: 0%
Trend: Up
Percentage point change from 2015: 5
Percent Achieved: 82%
Note: This metric shows the percentage point difference in six-year completion rates (see Goal 1 for a definition of this metric) between students of color and their white peers. A figure of 0% indicates no difference between white students and students of color; a negative figure indicates students of color are graduating at lower rates.
SLCC is a fiscally healthy and vibrant institution. Student enrollment for the past 20 years has followed economic trends. While enrollment patterns have not changed significantly, rapidly changing technology, increased pressure around accountability and efficiency, and changing demographics must be addressed. The demands of a knowledge economy have strained our capacity to accomplish goals.
Institutional Sustainability and Capacity Strategies (2021-2023)
Strategy No. 9: Increase College Participation
Salt Lake County participation in the public system of higher education has been decreasing for several years. This is due mostly to historically low unemployment rates, rising wages, shifting demographics, and the increased competition from non-traditional educational providers. To combat this, we are working on simplifying the enrollment process and collaborating with USHE to revive FAFSA completion efforts at the high school level. In addition, we are working to engage and welcome more communities by continuing to translate Admissions, Marketing, and Recruitment materials into Spanish.
Strategy No. 10: Develop & Implement Program-Level Learning Outcomes & Assessment
The aim of this strategy is to strengthen and expand program-level learning outcomes assessment processes and to incorporate them into instructional program review. This year, the focus is on piloting a stackable assessment process, using General Education assessment as a model. Strategy leads will also develop a shared assessment language for ease of communication across the institution.
Annualized Budget-Related, Full-Time Equivalent Enrollment
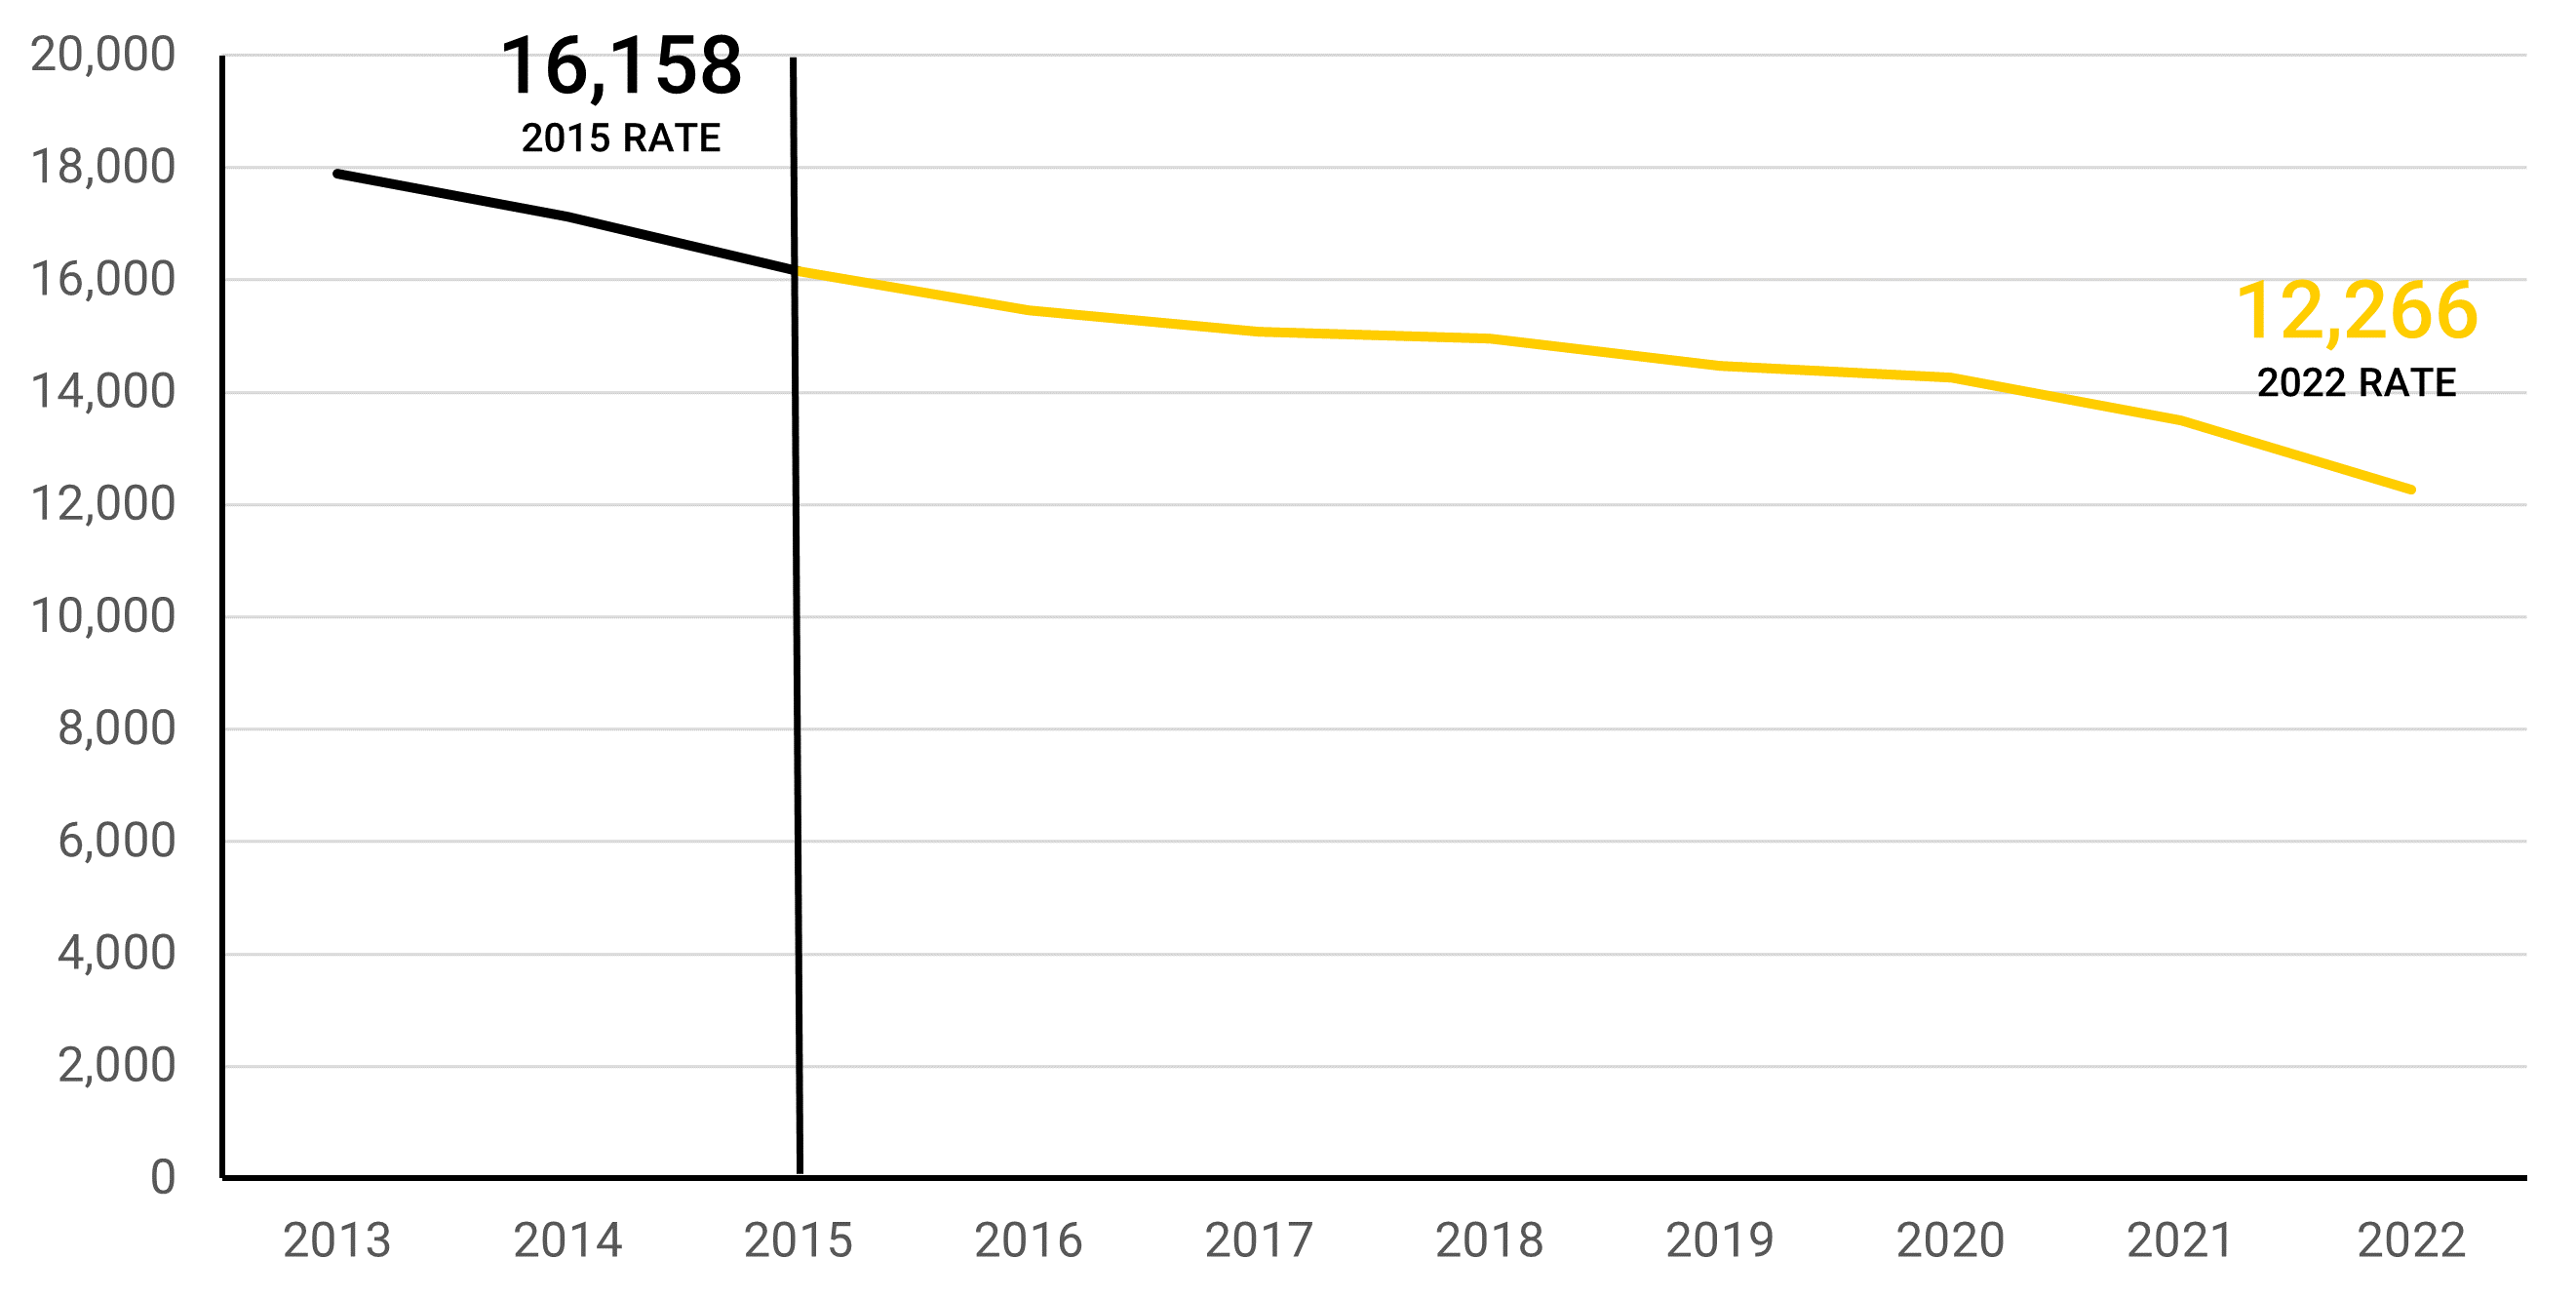
Target: 18,000
Trend: Down
Percentage point change from 2015: 24%
Percent Achieved: 68%
Note: Budget-related AFTE measures college revenue from student enrollment. FTE is calculated by dividing the total number.
Implementation
These ten strategies have evolved over the past seven years of the strategic plan and represent the primary focus of work undertaken in the current academic year. Previous strategies and initiatives remain important to the college, but have migrated to their functional areas and are no longer tracked closely by senior leadership. Each strategy and CWT is sponsored by a member of the executive cabinet, who prepare a charge at the beginning of the year; in turn the strategies are guided by strategy leads, who work with a committee to ensure each element of the charge is addressed. Strategy leads are asked to use a project management tool to provide monthly updates, which are reviewed by cabinet members.
You can view the current status of these strategies by clicking the Track Our Progress button below. For information on how you can be more involved in furthering the strategic plan, click Engagement. To learn about the evolution of these strategies, and how we arrived at our current goals and process, use the History button to explore the Strategy Archive.